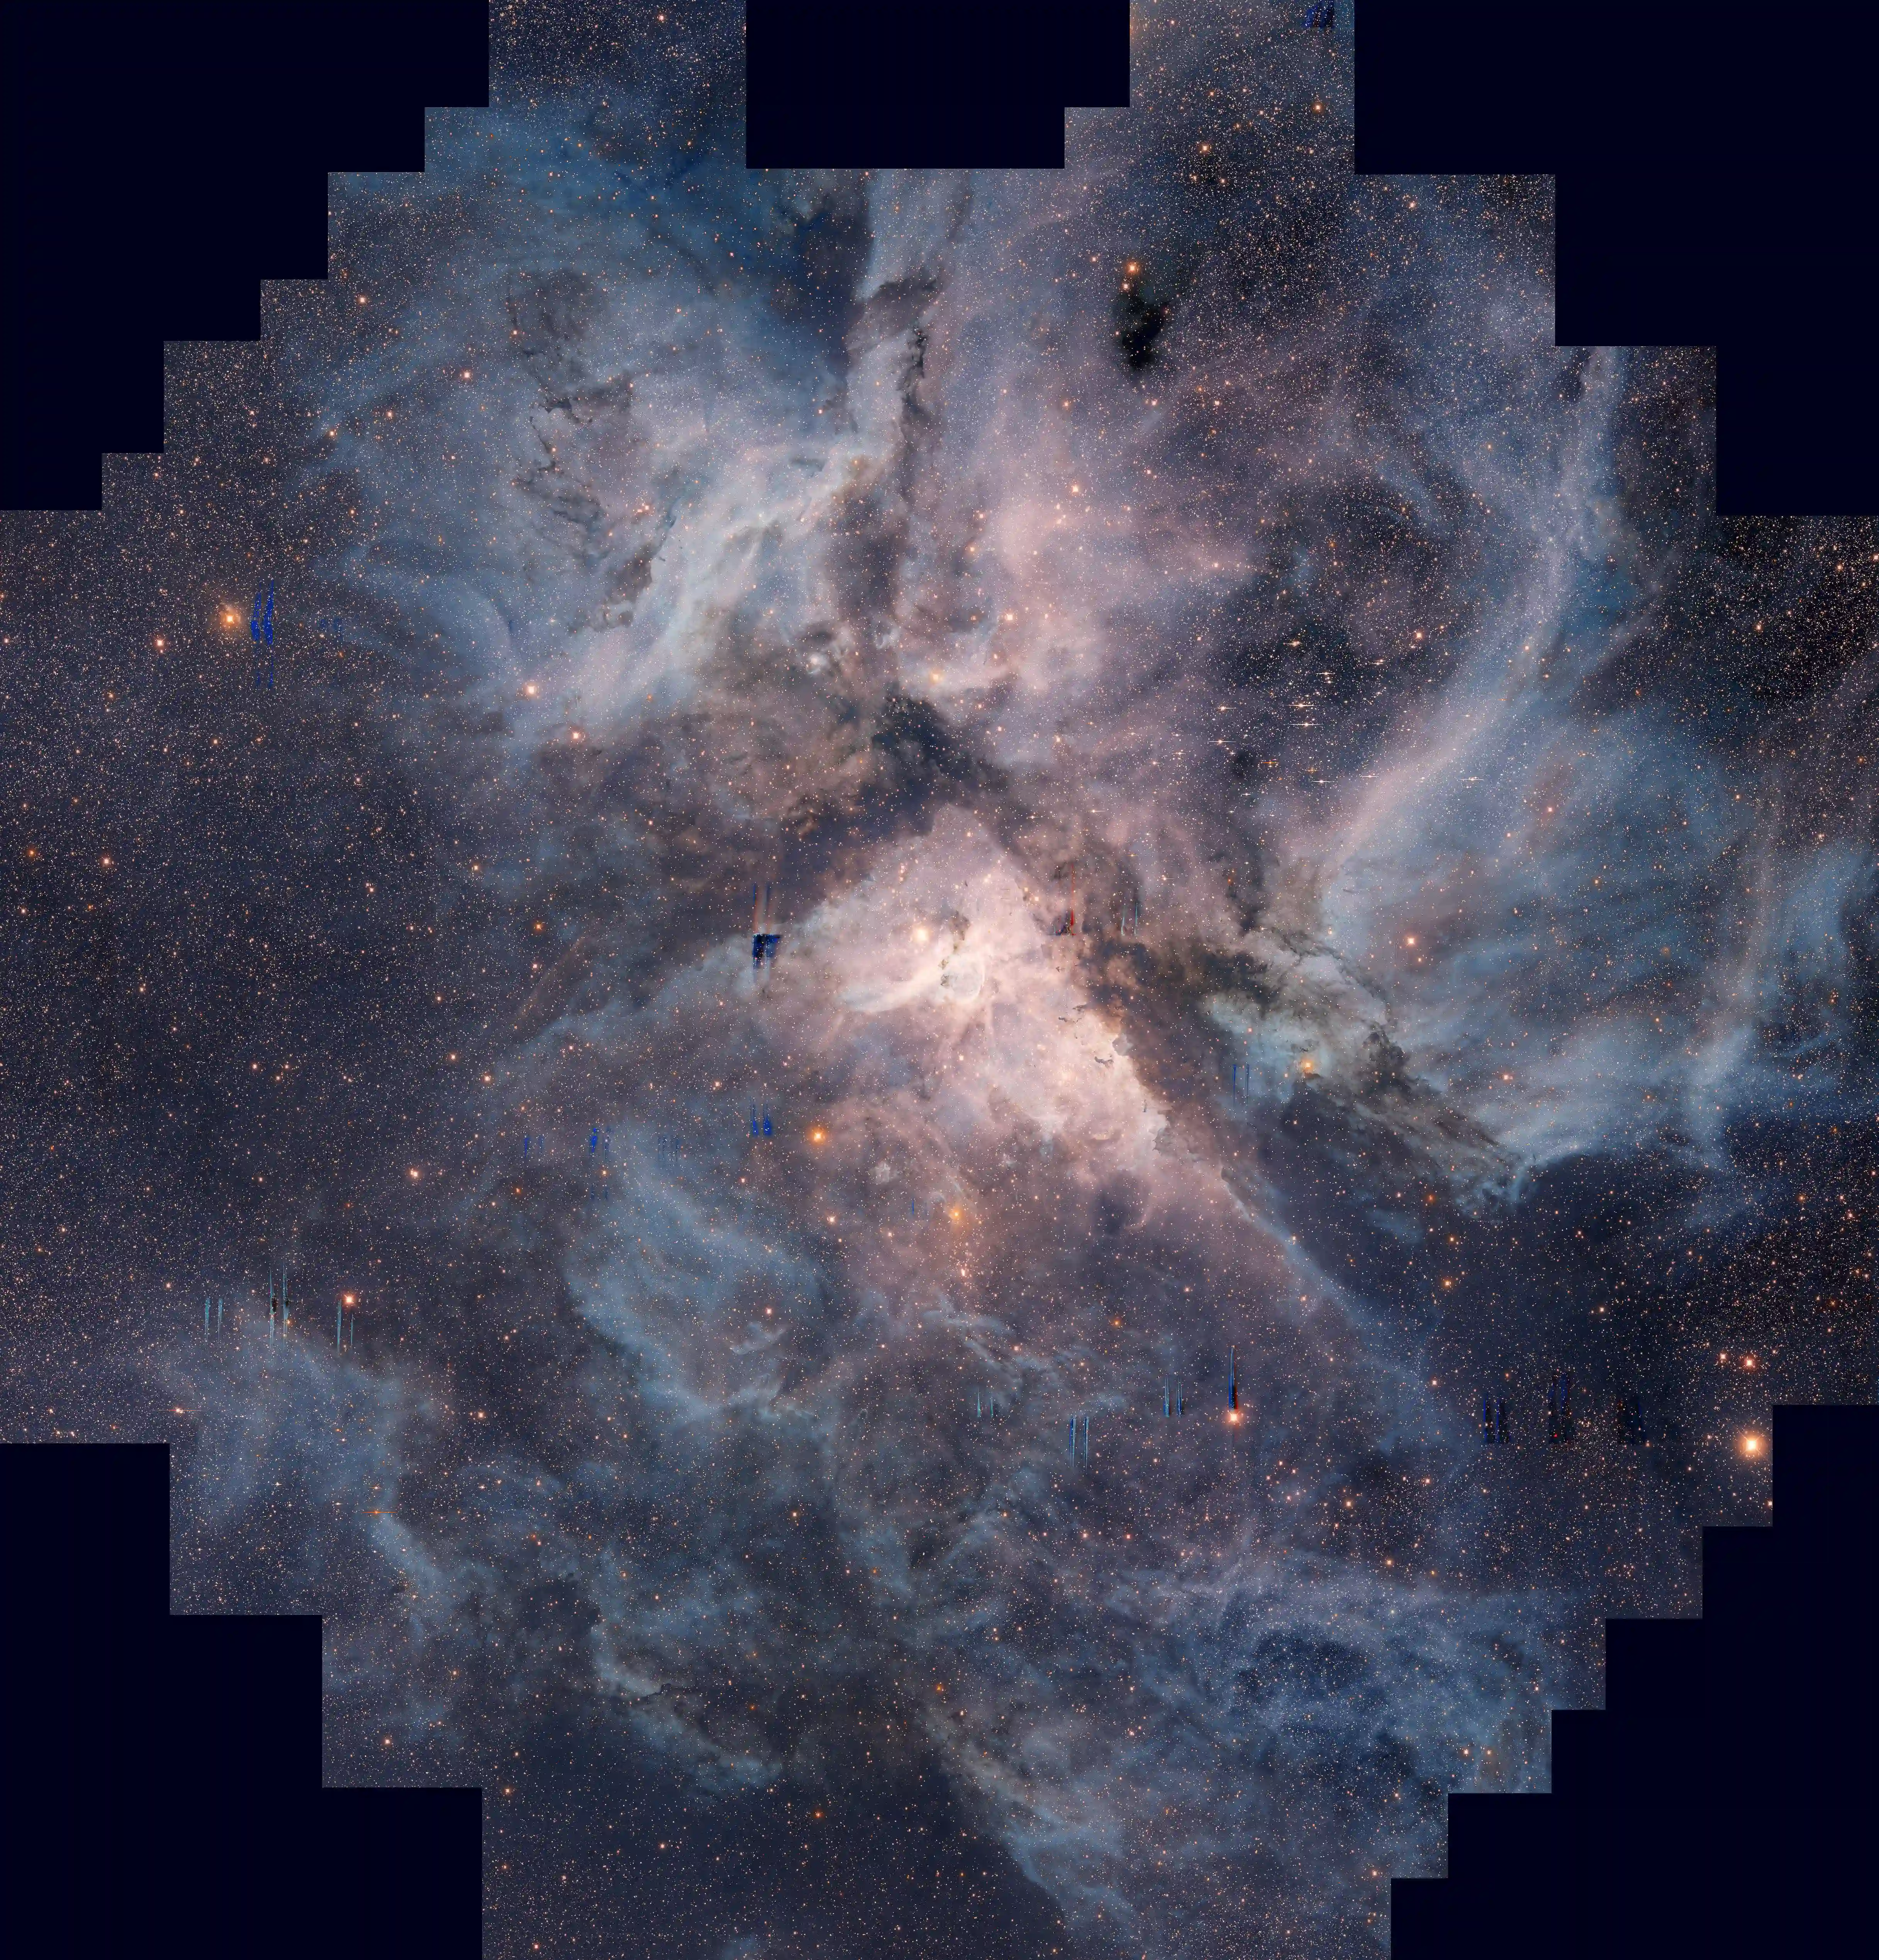
Carina Complex
· 2 min read
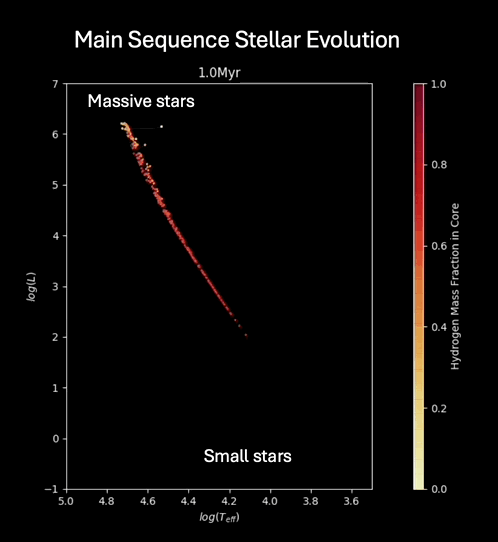
The Hertzsprung–Russell diagram (HR Diagram) shows the status of stars in a cluster, represented by points for each star defined by temperature or color on the x-axis and luminosity (energy production) on the y-axis. From a cloud of gas, most of the stars in a cluster will form around the same time and constitute a population of stars of different mass but roughly the same age. According to their mass, the stars will then move around. Brighter and hotter stars are on the top left.
